Portfolio - Projects
Ebenezer V
MIS Data Analyst
Chennai, India
About Me
Hii I’m experienced data professional from Chennai with 3.5 years of hands-on experience in different domains like Banking Operations and E-commerce (Online Retail)
Tools and technology that I've worked on Advance Excel,SQL,Tableau
Here I've done personal projects under different domains
Contact me:
Technical Skills
Advance Excel
Tableau
SQL
Project List
Restuarant Sales and Customer Behavior Analysis Using SQL
Global super store sales KPI dashboard by Advance Excel
Credit Card Spend Analysis by Tableau
PhonePe Pulse Data 2018-2022
Certification
Data Analytics by Tableau & Oracle SQL
HackerRanker SQL (Basics)
PhonePe Pulse Data 2019-2022
About Data🌎
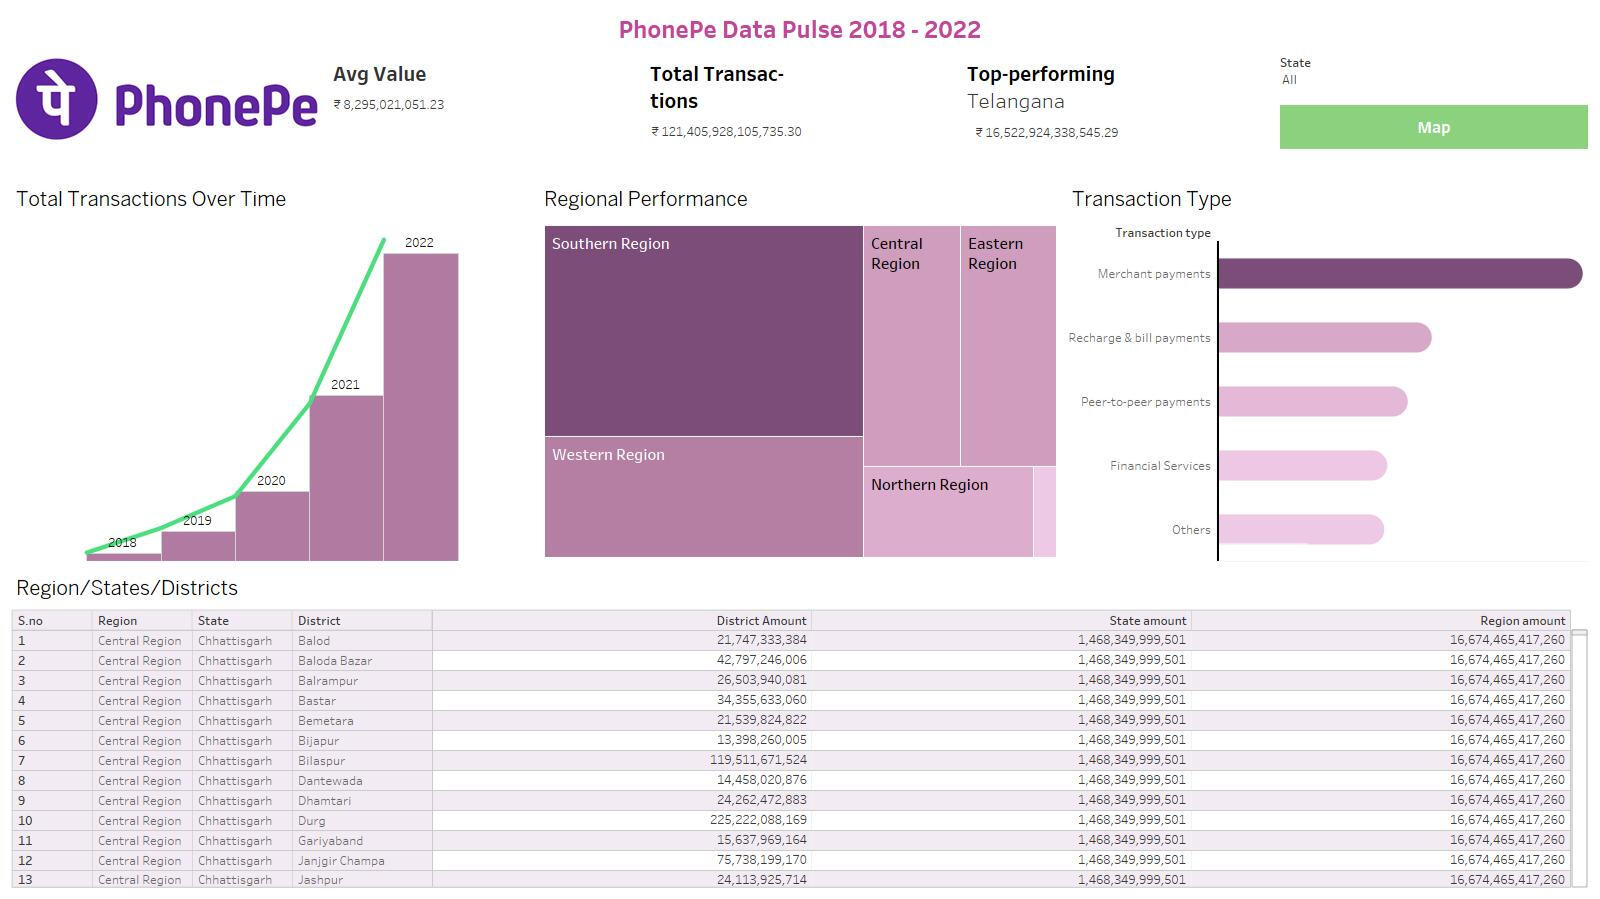
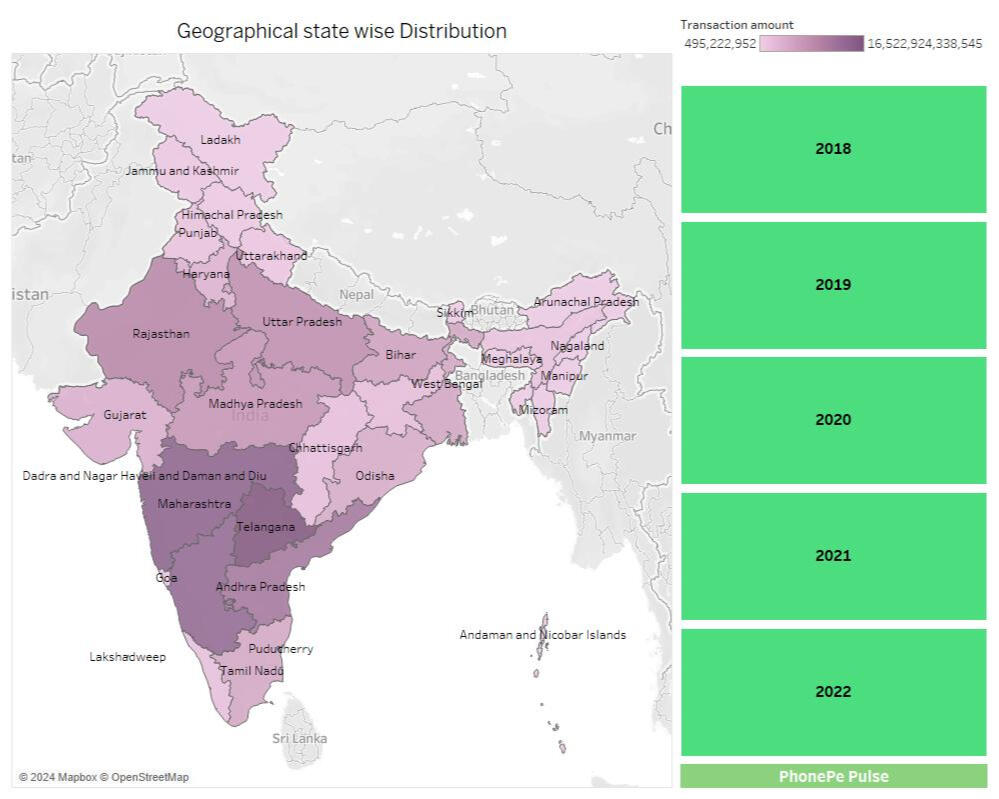
The dataset you contain PhonePe Pulse 2018-2022 transaction-related data for different states and districts in India.Tableau dashboard provide visualize and analyze transaction trends across time and geography. The rich combination of temporal, geographic, and transactional data insights such as identifying top-performing regions, tracking growth in transactions over time, and mapping transaction distribution geographically.Dataset provides detailed followings columns
State, District, District Amount, State Amount, Region Amount
Insights🚀
Key Performance Indicators (KPIs)
• Avg Value: Displays the average transaction value, shown as ₹8,295,021,051.23.
• Total Transactions: Shows the total value of transactions, displayed as ₹121,405,928,105,735.30.
• Top-performing: Highlights the top-performing state, Telangana, with transactions totalling ₹16,522,924,338,545.29.
Charts and Visuals
• Total Transactions Over Time:
o A bar and line chart combination is used to display the total transaction count over time, with bars representing the years from 2018 to 2022.
o The line in green shows the growth trajectory, indicating an increasing trend in transaction volumes.
• Regional Performance:
o A tree map visualizes the transaction performance by region, with each region represented as a different section. The Southern Region is the largest, indicating it has the highest transaction value, followed by the Western, Central, Eastern, and Northern Regions.
• Transaction Type:
o A horizontal bar chart categorizes the types of transactions, with the following categories:
Merchant payments (highest volume)
Recharge & bill payments
Peer-to-peer payments
Financial Services
Others
Map Section
• There is a placeholder for a map visualization, currently represented by a green "Map" button. This likely allows for interactive mapping of transaction data by state or district.
Concept covered
Lod (fixed)
Dual axis charts
Dashboards actions
Dashboards objects
Filters
Credit Card Spend Analysis by Tableau
𝗖𝗮𝘀𝗲 𝗦𝘁𝘂𝗱𝘆 𝗼𝗻 𝗖𝗿𝗲𝗱𝗶𝘁 𝗖𝗮𝗿𝗱𝘀 𝗦𝗽𝗲𝗻𝗱 𝗔𝗻𝗮𝗹𝘆𝘀𝗶𝘀 💳
with Tableau📅 𝗔𝗯𝗼𝘂𝘁 𝗗𝗮𝘁𝗮:
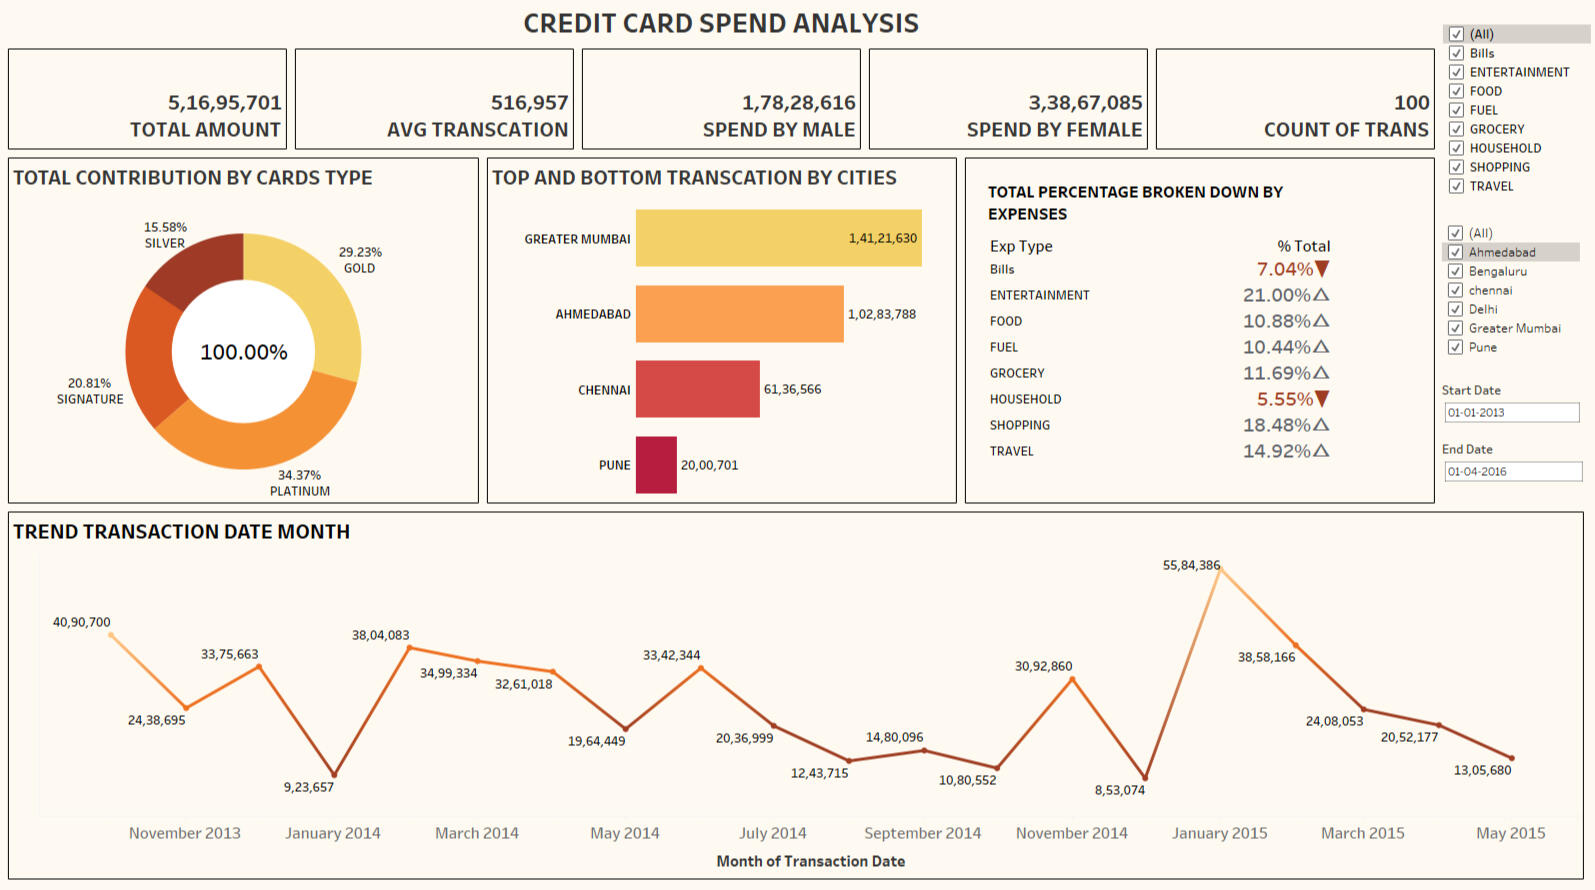
We have the data of the transactions made by credit cards in each city of India specifying the amount spent in each transaction.
The Credit Cards are of type Silver, Signature, Gold and Platinum.
The spends are usually done on expenses that includes Entertainment, Food, Bills, Fuel, Travel and Grocery
🛠 𝗧𝗼𝗼𝗹𝘀 𝗨𝘀𝗲𝗱:
Tableau Desktop (version 2021.3)
📚 Data Source:
Oracle SQL Database (version 18c)🔧 𝗔𝗻𝗮𝗹𝘆𝘀𝗶𝘀 𝗦𝗰𝗲𝗻𝗮𝗿𝗶𝗼𝘀:
KPI metrics:
*Total amount Spend
*Average Transaction Amount
*Totals spend by male
*Totals spend by female
*Total transactions made*Get the city with top and bottom total spend.
*Get the cards type and their contribution percentage in the overall spends.
*Get the spend percentage breakup by each expense.
*Get the transaction trends over the time.𝗖𝗼𝗻𝗰𝗲𝗽𝘁𝘀 𝗖𝗼𝘃𝗲𝗿𝗲𝗱:
*Table Calculations
*Parameters
*Sets & combined sets
*Charts (bars, line, Donut, Text table)
*Marks card (colors, legends, Tools tip, Labels)
*Formats (Axis, Work Sheet, Texts, Numbers)
*Dashboard (containers, actions, Text box)
*Filters (Dimension and measures)
Restuarant Sales and Customer Behavior Analysis Using SQL
📅 𝗔𝗯𝗼𝘂𝘁 𝗗𝗮𝘁𝗮:1. Menu Items Table
The menuitems dataset contains information about the items available on the menu. Each row represents a unique menu item, with the following columns:
• menuitemid: Unique identifier for each menu item.
• itemname: The name of the menu item.
• category: The category or type of cuisine the item belongs to (e.g., American, Italian).
• price: The price of the menu item in dollars.2. Order Details Table
The orderdetails dataset contains information about individual orders placed by customers. Each row represents a unique order detail, with the following columns:
• orderdetailsid: Unique identifier for each order detail record.
• orderid: Unique identifier for each order.
• orderdate: The date when the order was placed, formatted as MM/DD/YY.
• ordertime: The time when the order was placed.
• itemid: The identifier of the menu item ordered, corresponding to menuitemid in the menuitems dataset.
🛠 𝗧𝗼𝗼𝗹𝘀 𝗨𝘀𝗲𝗱:
Oracle SQL Database (version 18c)🔧𝗔𝗻𝗮𝗹𝘆𝘀𝗶𝘀 𝗦𝗰𝗲𝗻𝗮𝗿𝗶𝗼𝘀:Customer Behavior InsightsRepeat Orders: Track repeat orders of certain items or categories over time.
Popular Item Combinations: Identify frequently ordered item combinations.
Top-Selling Items by quantity highlight with case functionSales Performance AnalysisTotal Sales: Calculate the total sales revenue generated by each menu item and overall.
Best-Selling Items: Identify the top-selling items and their contribution to total sales
Category Analysis: Analyze sales performance by different categories (e.g., American, Italian).𝗖𝗼𝗻𝗰𝗲𝗽𝘁𝘀 𝗖𝗼𝘃𝗲𝗿𝗲𝗱:
Usage of Joins (left, right, self, cross joins two or more tables)
Usage of Single Row functions, character conversions
Usage of Grouping and Aggregation Functions.
Usage of CTE's and Subqueries
Usage of Window Functions like RANK, DENSE RANK, LEAD and LAG